Understanding property investment returns: why yield and capital growth both matter — and how to compare them like a professional. Every investment property earns its keep two ways: the rent it collects (yield) and the value it gains (capital growth). Almost every mistake we see investors make traces back to confusing the two — chasing a headline yield that evaporates after costs, or banking on growth that was never in the fundamentals. This guide shows you how to read the numbers correctly, compare properties on a like-for-like basis, and make a buying decision that suits your cash flow and investment horizon.
How to calculate gross yield on an investment property
Gross yield = annual rent ÷ purchase price.
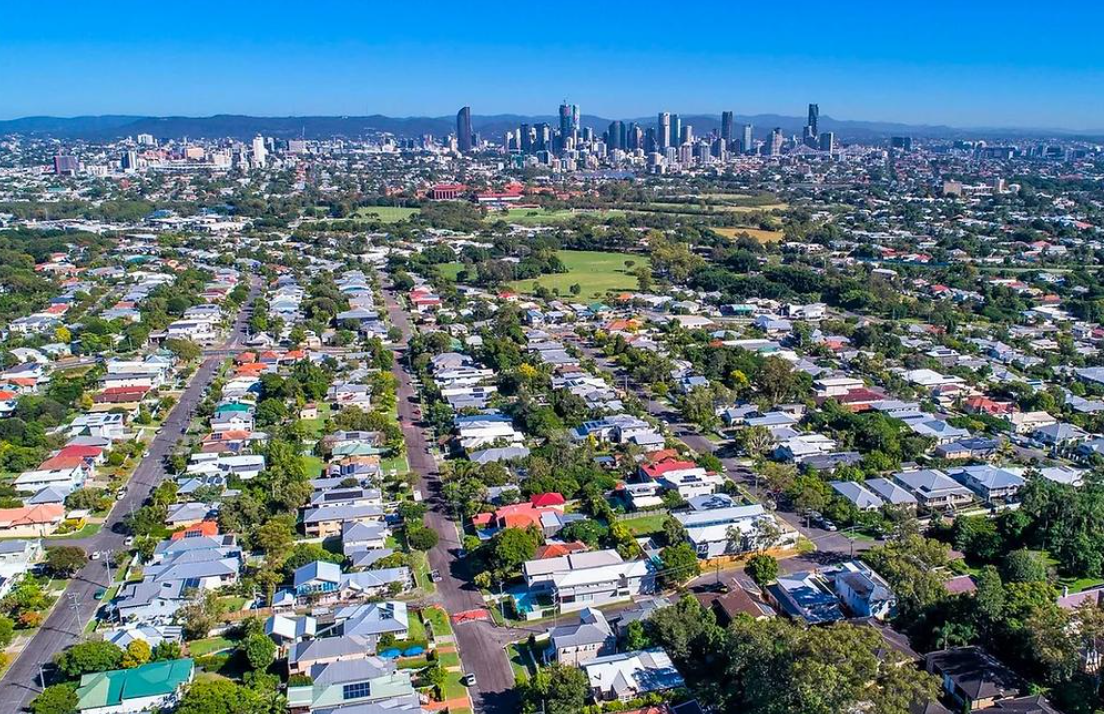
Example: a Brisbane unit bought for $800,000, renting at $650 a week, collects $33,800 a year. Gross yield: 4.2%. That is the number in every listing and every headline — and it is only the start of the story, because none of your costs have entered the picture yet.
Net yield vs gross yield: what property investors should compare
Now subtract what it really costs to hold: council and water rates, body corporate levies, landlord insurance, property management (typically 7-9% of rent), maintenance, and an allowance for vacancy — even in Brisbane's ultra-tight market, budget at least a week or two a year between tenants. On our example unit those costs might total $9,000-$10,000, leaving about $24,300:
Net yield ≈ 3.0% — a third of the headline gone. Two properties with identical gross yields can sit a full percentage point apart net (a house with no body corporate versus a high-amenity tower, say). Always compare net to net. Our cash flow calculator does this properly — down to the after-tax weekly cost under your own loan, income and expense assumptions.
Capital growth in property: powerful, but lumpy
Brisbane's median dwelling value rose about 10.8% in the year to July 2026 — and then fell 0.6% in July itself. That is capital growth in a nutshell: it arrives in bursts, pauses, sometimes reverses, and only becomes real money when you sell or refinance. Over a full decade it is usually the larger component of total return — driven mostly by land, which appreciates, rather than buildings, which wear out. But you cannot pay this quarter's interest bill with it.
The yield vs growth trade-off for houses, units and regional property
- Houses: more land content, historically stronger growth, lower yield, no body corporate but all maintenance is yours.
- Units and townhouses: higher yield, lower entry price, easier to hold — with levies and less land driving growth.
- High-yield regional: the yield compensates you for thinner buyer pools and lumpier growth. There is no free lunch — an unusually high yield is the market pricing some risk in.
Which mix is right depends on your income, borrowing capacity and horizon — a high earner with strong cash flow can afford to prioritise growth; an investor near retirement usually cannot carry years of negative cash flow.
How 2026 interest rates and negative gearing changes affect property cash flow
Two current realities sharpen all of this. First, with the cash rate at 4.35%, holding costs are the highest in years — a negatively geared property must earn its keep through genuinely superior growth prospects. Second, the May 2026 federal Budget moved to quarantine negative gearing on established homes bought after 12 May 2026 (from 1 July 2027, losses carry forward instead of reducing your salary tax) while new builds keep full negative gearing and depreciation — details in our plain-English guide. In short: for established stock, cash flow is about to stop being a tax question and become a pure budget question. The good news for landlords: Brisbane rents grew about 6.6% over the past year with vacancy near 0.9%, and flat prices plus rising rents means yields are improving for the first time in years.
Five steps to evaluate an investment property before you buy
- Work out net yield, not gross — cash flow calculator.
- Add entry costs to your price: stamp duty and, for foreign buyers, surcharges and FIRB fees.
- Stress-test the loan 1-2% higher — finance calculator.
- Ask what drives growth here: land content, infrastructure, supply constraints — not hope.
- Then decide with both engines in view, not one.
Browse current opportunities or talk to the PVI team about what the numbers look like on specific properties.
General information only, current as at 1 September 2026 — not financial or tax advice. Worked figures are illustrative; market data are third-party estimates.